Η παρούσα χρησιμοποιείται για να ξεκαθαρίσει θεωρίες νεοπαγανιστών, τους καθαρούς και απόλυτους λάτρεις του εθνισμού και του εθνικισμού και της διαστρέβλωσης των επιστημονικών πορισμάτων, όπως αυτές κυκλοφόρησαν σε ποικίλα περιοδικά (εδώ).
Am. J. Hum. Genet. 74:1023-1034, 2004
Ornella Semino,1 Chiara Magri,1 Giorgia Benuzzi,1 Alice A. Lin,2 Nadia Al-Zahery,1,4 Vincenza Battaglia,1 Liliana Maccioni,5 Costas Triantaphyllidis,6 Peidong Shen,7 Peter J. Oefner,7 Lev A. Zhivotovsky,8 Roy King,3 Antonio Torroni,1 L. Luca Cavalli-Sforza,2 Peter A. Underhill,2 and A. Silvana Santachiara-Benerecetti1 1Dipartimento di Genetica e Microbiologia ‘A. Buzzati Traverso,” Universita` di Pavia, Pavia, Italy; Departments of 2Genetics and 3Psychiatry and Behavioral Sciences, University of Stanford, Stanford; 4Department of Biotechnology, College of Science, University of Baghdad, Baghdad; 5Istituto di Clinica e Biologia Evolutiva, Universita` di Cagliari, Cagliari, Italy; 6Department of Genetics, Development and Molecular Biology, Aristotle University of Thessaloniki, Thessaloniki; 7Stanford Genome Technology Center, Palo Alto; and 8Vavilov Institute of General Genetics, Russian Academy of Science, Moscow
The phylogeography of Y-chromosome haplogroups E (Hg E) and J (Hg J) was investigated in 12,400 subjects from 29 populations, mainly from Europe and the Mediterranean area but also from Africa and Asia. The observed 501Hg E and 445 Hg J samples were subtyped using 36 binary markers and eight microsatellite loci. Spatial patterns reveal that (1) the two sister clades, J-M267 and J-M172, are distributed differentially within the Near East, North Africa, and Europe; (2) J-M267 was spread by two temporally distinct migratory episodes, the most recent one probably associated with the diffusion of Arab people; (3) E-M81 is typical of Berbers, and its presence in Iberia and Sicily is due to recent gene flow from North Africa; (4) J-M172(xM12) distribution is consistent with a Levantine/ Anatolian dispersal route to southeastern Europe and may reflect the spread of Anatolian farmers; and (5) E-M78 (for which microsatellite data suggest an eastern African origin) and, to a lesser extent, J-M12(M102) lineages would trace the subsequent diffusion of people from the southern Balkans to the west. A 7%-22% contribution of Y chromosomes from Greece to southern Italy was estimated by admixture analysis.
It has been proposed that the observed decreasing frequency gradients of Y-chromosome superhaplogroups E (Hg E) (defined by the SRY4064 mutation) and J (Hg J) (characterized by the 12f2a-8kb allele) (Semino et al. 1996; Hammer et al. 1998; Rosser et al. 2000) reached southwestern Europe as a result of demic expansions of Neolithic agriculturalists from the Middle East (Semino et al. 1996; Hammer et al. 1998). The spatial frequency patterns of Hg E and Hg J, at this level of molecular resolution, accommodate both infiltrations of Neolithic agriculturalists into southwestern Europe and cultural adaptations in western and northern Europe by indigenous Mesolithic peoples. This is consistent with the Neolithic migration hypothesis (Ammerman and Cavalli-Sforza 1984; Cavalli-Sforza 2002). However, this first-order level of molecular resolution does not readily reflect apparent complexities in regional and local archaeological sequences. The archaeological records suggest that the large-scale clinal patterns of Hg E and Hg J reflect a mosaic of numerous small-scale, more regional population movements, replacements, and subsequent expansions overlying previous ranges. The recent findings of many biallelic markers, which subdivide these two haplogroups, give us the opportunity to investigate the contribution of different population movements that have spread Hg E and Hg J. Through analysis of the Alu insertion (YAP), the M174 and SRY4064 mutations, and the 12f2a deletion, we identified haplogroups D (YAP/M174), E (YAP/ SRY4064), and J (12f2a) Y chromosomes in 12,400 males from 29 populations, mainly from Europe and the Mediterranean area but also from Africa and Asia. No subject belonged to the recently reported paragroup DE* (Weale at al. 2003), and only 6 belonged to the Asian-specific Hg D, whereas 501 were members of Hg E and 445 of Hg J. The survey of 36 biallelic markers in the Hg E and Hg J Y chromosomes allowed us to define the phylogenetic relationships of their numerous subclades (figs.1 and 2) and to analyze their distributions in the various geographic areas (tables 1 and 2). In addition, the survey of eight microsatellites (figs. 3 and 4) in a subset of these samples allowed investigation of the relative dating of different subclades.
Received December 17, 2003; accepted for publication February 6, 2004; electronically published April 6, 2004. Address for correspondence and reprints: Dr. Ornella Semino, Dipartimento di Genetica e Microbiologia, Universita` di Pavia, Via Ferrata, 1, 27100 Pavia, Italy. E-mail: semino@ipvgen.unipv.it2004 by The American Society of Human Genetics. All rights reserved. 0002-9297/2004/7405-0021$15.00
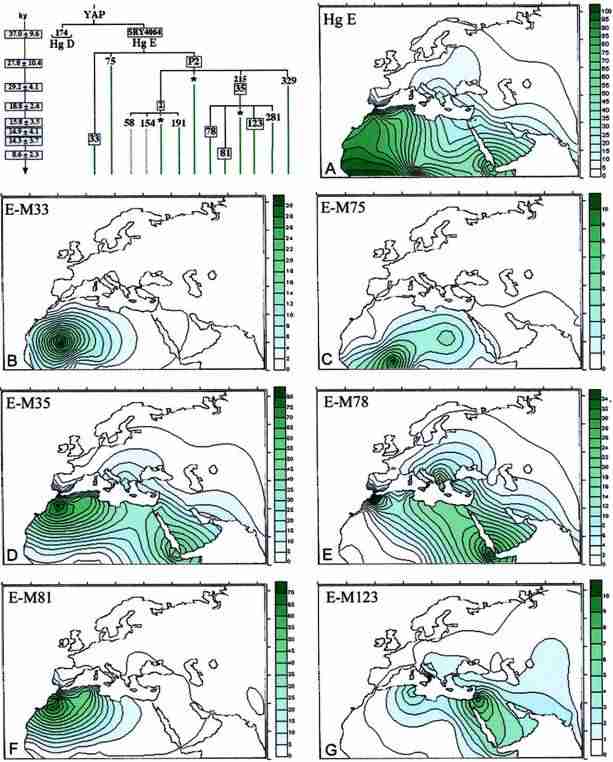
Figure 1 Phylogeny and frequency distributions of Hg E and its main subclades (panels A-G). The numbering of mutations is according to the Y Chromosome Consortium (YCC) (YCC 2002; Jobling and Tyler-Smith 2003). To the left of the phylogeny, the ages (in 1,000 years) of the boxed mutations are reported, with their SEs (Zhivotovsky et al. 2004). Because the procedure used is based on STR data, it actually
estimates the ages of STR variation observed within the corresponding haplogroup in the studied populations. With the exception of the value relative to SRY4064 mutation, which as been calculated as TD (with V0 p 0 ) between the sister clades Hg E-P2 and Hg E-M33, the other values were estimated as the average squared difference (ASD) in the number of repeats between all current chromosomes of a sample and the founder haplotype, which has an expected value mt for single-step mutations (Thomas et al. 1998) and wt for a general mutation scheme, where w is an average effective mutation rate at the
loci, taken as 6.9 # 10 4 per 25 years (Zhivotovsky
et al.
2004) (microsatellite data
available on request). In some cases, because of small sample sizes or long time passed since the occurrence of the mutation, the founder haplotype could not be reliably estimated as a modal haplotype. Therefore, we constructed it from modal alleles at single loci, although this can underestimate the age if the candidate founder haplotype differs from the real one. To make the computation of the P2 and M35 ages independent from those of their most-represented subclades, the STR variation observed at only the “asterisk” lineages (e.g., E-P2*) has been used. The M35 estimate is in agreement with those of Bosch et al. (2001) and Cruciani et al. (2004 [in this issue]), obtained with different methods. The YAP insertion was studied as an amplified fragment-length polymorphism (Hammer and Horai 1995). The other mutations were investigated in a hierarchical order by use of the denaturing high-performance liquid chromatography (DHPLC) methodology (Underhill et al. 2001). Subhaplogroups observed in this study are illustrated by continuous lines, whereas subhaplogroups discussed elsewhere are indicated by dotted lines. For simplicity, the prefix “M” was omitted from
the name of the marker
mutations. Haplogroup-frequency surfaces
were graphically computer reconstructed following the Kringing procedure (Delfiner 1976) by use of the Surfer System (Golden Software) and the data reported in table 1.
Hg E (fig. 1A) is observed in Africa, Europe, and the Near East and includes the subhaplogroups E-M33, E- M75, and the most widespread subclade, E-P2. The latter includes three clusters, two of which, E-M2 and E- M35, are the most widespread. Haplogroups E-M33 (fig.1B), E-M75 (fig. 1C), and the not-shown E-P2* and E- M2 are virtually absent in European populations and appear to be geographically restricted to sub-Saharan Africa. The E-P2* lineages were observed mainly in Ethiopians, whereas E-M2, which is considered a signature of the Bantu expansion (Hammer et al. 1998; Passarino et al.1998; Scozzari et al. 1999), shows its highest frequency(180%) in Senegal and has been sporadically observed in North Africa and Iraq. E-M35 (fig. 1D) has been found in Africa, the Near East, and Europe, where it is believed to have arrived in Neolithic times (Hammer et al. 1998; Semino et al. 2000). In particular, from among its subgroups, E-M78 (fig. 1E) is present in Europe, the Middle East, and North and East Africa. However, whereas no preferential YCAII microsatellite motif is observed in the Middle East, prevalent associations with YCAIIa21-YCAIIb19 in Europe and YCAIIa22- YCAIIb19 in Africa are found. E-M81 (fig. 1F) is almost absent in Europe (with the exception of Sicily and Iberia) and the Middle East but characterizes the majority of the Y chromosomes of populations from northwestern Africa. E-M123 (fig. 1G) is spread in the Near East and is also observed in North Africa and Europe but does not reach the western European regions. E-M281 and E-M329 are geographically restricted, having been seen only in Ethiopians (two subjects each). The remaining 37 E-M35* Y chromosomes were found mainly in Africa, with a high frequency in the Ethiopians and the Khoisan.
Both phylogeography and microsatellite variance suggest that E-P2 and its derivative, E-M35, probably originated in eastern Africa. This inference is further supported by the presence of additional Hg E lineal diversification and by the highest frequency of E-P2* and E-M35* in the same region. The distribution of E-P2* appears limited to eastern African peoples. The E-M35* lineage shows its highest frequency (19.2%) in the Ethiopian Oromo but with a wider distribution range than E-P2*. Indeed, it is also found at high frequency (16.7%) in the Khoisan of South Africa (Underhill et al. 2000; Cruciani et al. 2002) (suggesting, once again, their ancient relationship with Ethiopians) and observed in southern Europe (present study). It is interesting that both E-P2* and E-M35* and their derivatives, E-M78 and E-M123, exhibit in Ethiopians the 12-repeat allele at the DYS392 microsatellite locus, an allele scarcely seen (Y-Chromo- some STR Database), especially in other haplogroups and other populations (A.S.S.-B., unpublished data). In addition, the Ethiopian DYS392-12 allele is usually associated with the unusually short DYS19-11 allele, which is typical of this area. These findings are not easily explained. One possible scenario is that an ancient differentiation of the E-P2 haplogroup occurred in loco (East Africa). However, this also implies a low mutability of the associated microsatellite motif (DYS392-12/DYS19-11). Alternatively, the microsatellite motif may be due to homoplasy.
The first scenario is more likely, since this unique microsatellite haplotype occurs in E-P2*, E-M35*, and EM78 but is almost absent in all other haplogroups and populations. In addition, the high stability of the DYS392 locus (Brinkmann et al. 1998; Nebel et al. 2001) and of the shorter alleles of DYS19 (Carvalho-Silva et al. 1999) has been reported elsewhere. Moreover, the observation that the derivative E-M78 displays the DYS392-12/ DYS19-11 haplotype suggests that it also arose in East Africa. This is illustrated by the microsatellite network (fig. 3, shaded area), which reveals that the Ethiopian branch harboring DYS392-12 is not shared with either Near Eastern or European populations. The very low frequency of E-M123 in Ethiopia does not allow any inferences about the origin of this clade. The network of E- M78 and that of E-M123 are in agreement with the hypothesis of their ancient presence in the Near East and their subsequent expansion into the southern Balkans. The divergence time (TD) (Zhivotovsky 2001) between the Near East and European lineages has been estimated to a range of 7-14 thousand years (ky) ago. Cinniog˘ lu et al. (2004) found a high degree of variance of E-M123 in Turkey, which has been interpreted as being due to multiple founders rather than a single early dispersal event that has remained geographically circumscribed. E-M81 has the lowest variance and a compact network (fig. 3), indicating either its relatively recent origin followed by expansion or its recent expansion after a bottleneck. In Europe, this clade is restricted to the southernmost regions, such as Iberia and Sicily, and the absence of microsatellite variation suggests a very recent arrival from North Africa, consistent with previous observations (Bosch et al. 2001). The frequency pattern and the microsatellite network of E-M2(xM191) (fig. 3) indicate a West African origin followed by expansion, a result that is in agreement with the findings of Cruciani et al. (2002).
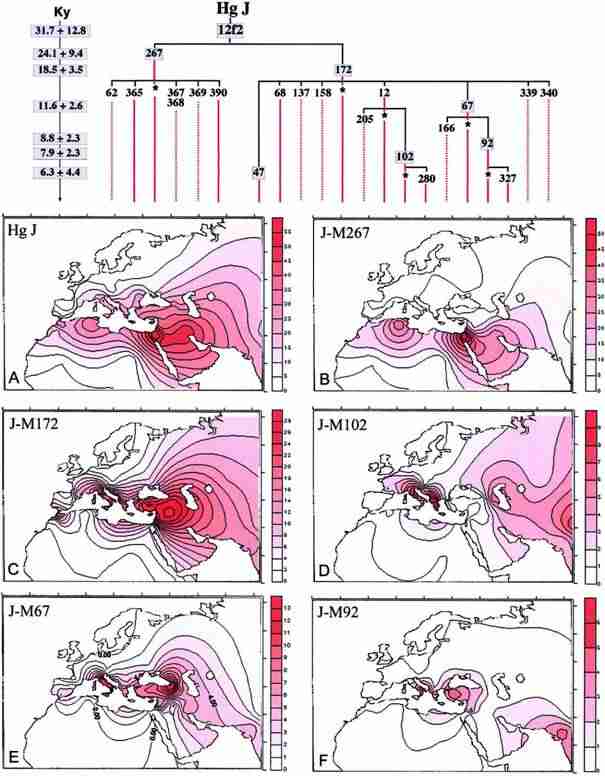
Figure 2 Phylogeny and frequency distributions of Hg J and its main subclades (panels A-F). The numbering of mutations is according to the YCC (YCC 2002; Jobling and Tyler-Smith 2003). To the left of the phylogeny, the ages (in 1,000 years) of the boxed mutations are reported, with their SEs (Zhivotovsky et al. 2004). With the exception of the age relative to the 12f2 mutation, which has been estimated as TD (with V0 p 0) between the combined data of the two sister clades Hg J-M267 and Hg J-M172, the other values have been determined as ASD, as described in figure 1. The 12f2a marker was examined as an RFLP by Southern blotting (Passarino et al. 1998); the other mutations were investigated in hierarchical order by use of DHPLC methodology (Underhill et al. 2001). Three new mutations, M327, M280, and M390, were found in this study. M327 is a TrC transition at np 404 within the STS containing mutation M92, M280 is a GrA transition at np 330 within the STS containing the mutation M67, and M390 is an A insertion after nt 175 in the STS containing the M365 mutation. Conventions used are the same as for figure 1. The frequency surfaces were drawn using the data reported in table 2 and, for Hg J (panel A), also the data from Rosser et al. (2000), Quintana-Murci et al. (2001), and Scozzari et al. (2001).
The 12f2a mutation, which characterizes haplogroup J, was observed in 445 subjects. Hg J harbors two main clades (see phylogeny in fig. 2), J-M267 (Cinniog˘ lu et al. 2004) and J-M172. J-M172 is the more frequent and currently differentiates into eight subhaplogroups defined by mutations M12/M102, M47, M67/M92, M68, M137, M158, M339, and M340, four of which occur at informative frequencies. The less-heterogeneous clade J-M267 includes all of the other 12f2a Y chromosomes that were reported elsewhere as Eu10 (Semino et al. 2000). Its current level of subdivision includes five scarcely rep- resented subclusters defined by mutations M62, M365, M367/M368, and M369 (Cinniog˘ lu et al. 2004) and by the new mutation M390. Similar to Hg E, different geo- graphic distributions are displayed by the various sub- haplogroups of J (fig. 2). J-M172 (fig. 2C), which occurs as frequently as J-M267 (fig. 2B) in some Middle Eastern populations, is the more prevalent in Europe. Among its subclades, J-M137, J-M158, J-M339, and J-M340 were reported elsewhere as single observations (Underhill et al. 2000; Cinniog˘ lu et al. 2004) and have not been ob- served in this study. Likewise, J-M47 and J-M68 characterize very few Near Eastern and Asian samples. How- ever, J-M12 and J-M67 and their derivatives are in- formative, being diffused in Europe and observed also in Asia. J-M12 is almost totally represented by its sub- lineage J-M102, which shows frequency peaks in both the southern Balkans and north-central Italy (fig. 2D). The history underlying this apparent affinity remains uncertain. J-M67 (fig. 2E) includes J-M67* lineages (not shown), which are most frequent in the Caucasus, and J-M92, which indicates affinity between Anatolia and southern Italy (fig. 2F). Finally, the J-M172* lineages display a decreasing frequency gradient from the Near East toward western Europe and strongly contribute to the overall gradient of Hg J. J-M267 is notable, since this haplogroup shows its highest frequencies in the Middle East, North Africa, and Ethiopia (fig. 2B) and its lowest in Europe, having been observed only in the Mediterranean area. Of its five subhaplogroups, only two have been observed: the J-M365 (in two Turks and one Georgian) and the new subclade J-M390 (in one Lebanese).
Table 1
![]()
Population Frequencies of Hg E and Its Subclades
HG E FREQUENCY OF E SUBHAPLOGROUP b HG D
POPULATION/REGIONa No. % 2*c 58 191 154 P2* 329 35* 123 78 81 281 33 75 No. %
Arab (Morocco)d (49) 37 75.5 42.9 32.6
Arab (Morocco)e (44) 32 72.7 6.8 2.3 11.4 52.3
Berber (Morocco)d (64) 55 85.9 4.7 10.9 68.7 1.6
Berber (north-central Morocco)e (63)55 87.3 9.5 7.9 1.6 65.1 3.2
Berber (southern Morocco)e (40) 35 87.5 2.5 7.5 12.5 65.0
Saharawish (North Africa)e (29) 24 82.7 3.4 75.9 3.4
Algerian (32) 21 65.6 3.1 3.1 6.3 53.1
Tunisian (58) 32 55.2 3.4 3.4 5.2 15.5 27.6
Malif (44) 37 84.1 20.5 29.5 34.1
Burkina Fasod (106) 105 99.1 67.9 1.9 13.2 .9 3.8 11.3
North Cameroond (152) 69 45.4 20.3 12.5 1.3 7.9 3.3
South Cameroond (89) 83 93.3 43.8 40.4 9.0
Senegaleseg (139) 136 97.8 80.6 .7 2.9 5.0 .7 .7 5.0 2.9
Bantu (South Africa)f (53) 44 83.0 54.7 5.7 3.8 1.9 1.9 15.1
Khoisan (South Africa)d (90) 59 65.6 31.1 11.1 1.1 16.7 5.6
Sudanf (40) 12 30.0 17.5 5.0 2.5 5.0
Ethiopian (Oromo)g (78) 62 79.5 12.8 2.6 19.2 5.1 35.9 2.6 1.3
Ethiopian (Amhara)g (48) 22 45.8 10.4 10.4 2.1 22.9
Iraqi (218) 20 9.2 .9 2.8 5.5
Lebanese (42) 8 19.0 4.8 11.9 2.4
Ashkenazim Jewish (77) 14 18.2 1.3 11.7 5.2
Sephardim Jewish (40) 12 30.0 2.5 10.0 12.5 5.0
Turkish (Istanbul) (46) 6 13.0 2.2 8.7 2.2
Turkish (Konya) (117) 17 14.5 1.7 12.8 1 .9
Georgian (41) 0 .0
Balkarian (southern Caucasus) (39) 1 2.6 2.6
Northern Greek (Macedonia) (59) 12 20.3 1.7 18.6
Greek (84) 20 23.8 2.4 21.4
Albanian (44) 11 25.0 25.0
Croatian (57) 5 8.8 1.8 7.0
Hungarian (53) 5 9.4 1.9 7.5
Ukrainian (93) 8 8.6 1.1 7.5
Polish (99) 4 4.0 4.0
Italian (north-central Italy) (56) 6 10.7 10.7
Italian (Calabria 1) (80) 18 22.5 1.3 2.5 16.3 1.3 1.3
Italian (Calabria 2)h (68) 16 23.5 1.5 13.2 5.9 2.9
Italian (Apulia) (86) 12 13.9 2.3 11.6
Italian (Sicily) (55) 15 27.3 5.5 3.6 12.7 5.5
Italian (Sardinia) (139) 7 5.0 .7 1.4 2.9
Dutch (34) 0 .0
Bearnais (27) 1 3.7 3.7
French Basque (45) 0 .0
Spanish Basque (48) 1 2.1 2.1
Catalan (33) 2 6.1 3.0 3.0
Andalusian (76) 7 9.2 3.9 5.3
Andalusiane (37) 4 10.8 2.7 1 2.7 5.4
Hindu (India) (47) 0 .0
Tharu (Nepal) (98) 0 .0 4 4.1
Chinese (65) 0 .0 1 1.5
a Numbers in parentheses indicate the number of Y chromosomes analyzed. The population samples include those reported by Semino et al. (2000, 2002), Passarino et al. (1998), and Al-Zahery et al. (2003).
b An asterisk (*) indicates chromosomes that belong to a clade but not its subclades.
c The clade 2* also includes the subhaplogroups classified elsewhere as M116.1, M155 (Underhill et al. 2000), M10, and M149 (Cruciani et al. 2002).
d Data from Cruciani et al. (2002) and F. Cruciani, personal communication.
e Data from Bosch et al. (2001).
f Data from Underhill et al. (2000).
g Data from Semino et al. (2002).
h The sample “Calabria 2” refers to the Albanian community of the Cosenza province (Torroni et al. 1990).
Table 2
Population Frequencies of Hg J and Its Subclades
FREQUENCY OF J SUBHAPLOGROUPb
HG J M172 M267c
POPULATION/REGIONa No. % 172* 158 12* 102* 280 47 67* 92* 327 68 Total % 267* 62 365 390
Arab (Morocco)d (49) 20 20.4 10.2 10.2 10.2
Arab (Morocco)e (44) 7 15.9 2.3 13.6
Berber (Morocco)d (64) 4 6.3 6.3
Berber (Morocco)e (103) 11 10.7 2.9 7.8
Saharawish (North Africa)e (29) 5 17.2 17.2
Algerian (20) 7 35.0 35.0
Tunisian (73) 25 34.2 1.4 1.4 1.4 4.1 30.1
Sudanf (40) 0 .0
Ethiopian (Amhara) (48) 17 35.4 2.1 2.1 33.3
Ethiopian (Oromo) (78) 3 3.8 1.3 1.3 2.6
Iraqi (156) 79 50.6 10.2 2.6 2.6 4.5 1.3 1.3 22.4 28.2
Lebanese (40) 15 37.5 20.0 2.5 2.5 25.0 10.0 2.5
Muslim Kurdg (95) 38 40.0 28.4 11.6
Palestinian Arabg (143) 79 55.2 16.8 38.4
Bedouing (32) 21 65.6 3.1 62.5
Ashkenazim Jewish (82) 31 37.8 12.2 1.2 4.9 4.9 23.2 14.6
Sephardim Jewish (42) 17 40.5 23.8 2.4 2.4 28.6 11.9
Turkish (Istanbul) (73) 18 24.7 11.0 2.7 4.1 17.8 5.5 1.4
Turkish (Konya) (129) 41 31.8 17.8 .8 .8 3.1 4.6 .8 27.9 3.1 .8
Georgian (45) 15 33.3 8.9 2.2 13.3 2.2 26.7 4.4 2.2
Balkarian (southern Caucasus) (16)4 25.0 12.5 6.3 6.3 25.0
Northern Greek (Macedonia) (56) 8 14.3 3.6 5.4 3.6 12.5 1.8
Greek (92) 21 22.8 4.3 6.5 2.2 4.3 3.3 20.6 2.2
Albanian (56) 13 23.2 14.3 3.6 1.8 19.6 3.6
Croatian (48) 3 6.2 6.2 6.2
Hungarian (49) 1 2.0 2.0 2.0
Ukrainian (82) 6 7.3 2.4 2.4 1.2 1.2 7.3
Polish (97) 1 1.0 1.0 1.0
Italian (north-central Italy) (52) 14 26.9 5.8 9.6 9.6 1.9 26.9
Italian (Calabria 1) (57) 14 24.6 14.0 1.8 3.5 3.5 22.8 1.8
Italian (Calabria 2)h (45) 9 20.0 4.4 8.9 6.6 20.0
Italian (Apulia) (86) 27 31.4 16.3 3.5 2.3 7.0 29.1 2.3
Italian (Sicily) (42) 10 23.8 11.9 2.4 2.4 16.7 7.1
Italian (Sardinia) (144) 18 12.5 2.8 2.1 2.8 2.1 9.7 2.8
Dutch (34) 0 .0
Bearnais (26) 2 7.7 3.8 3.8 7.7
French Basque (44) 6 13.6 13.6 13.6
Spanish Basque (48) 0 .0
Catalan (28) 1 3.6 3.6 3.6
Andalusian (93) 8 8.6 2.2 1.1 3.2 1.1 7.5 1.1
Hunza (Pakistan)f (38) 5 13.2 2.6 7.9 10.5 2.6
Pakistan-Indiaf (88) 21 23.9 3.4 1.1 2.3 3.4 1.1 4.5 15.9 7.9
Hindu (India) (76) 4 5.3 2.6 1.3 1.3 5.3
Tharu (Nepal) (50) 7 14.0 8.0 6.0 14.0
Central Asiaf (184) 40 21.7 6.5 .5 2.2 .5 1.1 .5 .5 11.9 9.2 .5
Chinese (65) 0 .0
a Numbers in parentheses indicate the number of Y chromosomes analyzed. The population samples include those reported by Santachiara-Benerecetti et al. (1993), Semino et al. (1996, 2000, 2002), Passarino et al. (1998), and Al-Zahery et al. (2003).
b An asterisk (*) indicates chromosomes that belong to a clade but not its subclades.
c All chromosomes classified as J* (because of not belonging to J-M172) by Cruciani et al. (2002), Nebel et al. (2001), and Bosch et al.
(2001) were considered members of J-M267*.
d Data from Cruciani et al. (2002).
e Data from Bosch et al. (2001). These samples were not subclassified and are reported only in the “M172 Total” column.
f Data from Underhill et al. (2000).
g Data from Nebel et al. (2001).
h The sample “Calabria 2” refers to the Albanian community of the Cosenza province (Torroni et al. 1990).
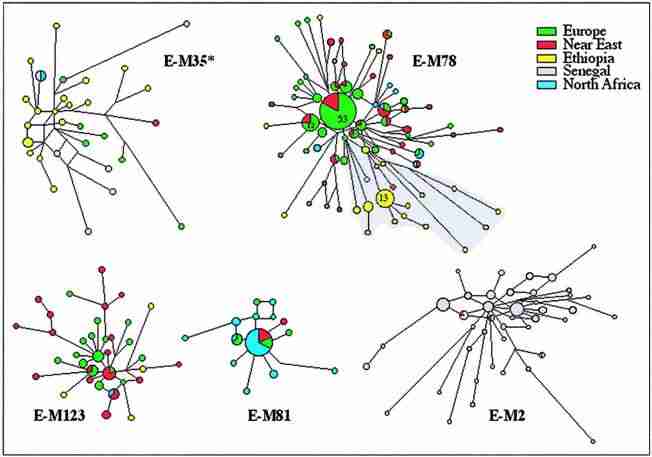
Figure 3 Networks of the STR haplotypes of the main subhaplogroups of Hg E. These networks were obtained by the analysis of a subsetof the samples for the following microsatellites: YCAIIa, YCAIIb (Mathias et al. 1994), DYS19, DYS389, DYS390, DYS391, and DYS392 (Roewer et al. 1996). The phylogenetic relationships between the microsatellite haplotypes were determined using the program NETWORK 2.0b (Fluxus Engineering). Networks were calculated by the median-joining method (p 0 ) (Bandelt et al. 1995), weighting the STR loci according to their relative variability in Hg E and, with the exception of E-M81, after having processed the data with the reduced-median method. Circles represent the microsatellite haplotypes. Unless otherwise indicated by a number on the pie chart, the area of the circles and the area of the sectors are proportional to the haplotype frequency in the haplogroup and in the geographic area indicated by the color. The smallest circle of each network corresponds to one Y chromosome. The shaded area in E-M78 indicates the branch characterized by the DYS392-12 allele.
The extent of differentiation of Hg J, observed both with the biallelic and microsatellite markers, points to the Middle East as its likely homeland. In this area, J- M172 and J-M267 are equally represented and show the highest degree of internal variation, indicating that it is most likely that these subclades also arose in the Middle East. However, their different frequencies in different Middle Eastern countries and in Europe suggest distinct demography processes, possibly in population groups that underwent different temporal expansions. This is especially true for J-M172. The majority of its lineages are undifferentiated and thus potentially paraphyletic (fig.4). Although J-M172* encompasses most of the M172 Y chromosomes in continental Europe and India (Kivi- sild et al. 2003; present study), their degree of affinity and shared history remain uncertain. The J-M67*, J- M92, and J-M102 representatives reflect more distinctive origins and dispersal patterns. Whereas J-M67* and J-M92 show higher frequencies and variances in Europe (0.40 and 0.32, respectively) and in Turkey (0.32 and 0.30, respectively [Cinniog˘ lu et al. 2004]) than in the Middle East (0.17 and 0.09, respectively), J-M12(M102) shows its maximum frequency in the Balkans. In spite of the relative high value of variance of this haplogroup in Turkey (Cinniog˘ lu et al. 2004)-which, however, could be due to multiple arrivals-the pattern of distribution and the network of J-M12(M102) (figs. 2 and 4) are consistent with its diffusion in Europe from the southern Balkans. On the contrary, J-M67* and J-M92 could have arrived in Europe from Anatolia via the Bosphorus isthmus, as well as by seafaring Neolithic populations who reached southern Italy. J-M67* and J-M92 could rep- resent, at least in part, the Y-chromosome component that King and Underhill (2002) found to correlate with the distribution, from Anatolia toward Europe, of archaeological painted pottery and anthropomorphic figurines. On the other hand, J-M67- and J-M12-related lineages have been observed in Pakistan and India; thus, they probably have marked other migratory events, but the small number of J subclades in these regions (Underhill et al. 2000; Kivisild et al. 2003; present study) does not allow an evaluation of the mode and time of their arrival.Southern Italy (Apulia and Calabria) contains sites of the early Neolithic period (Whitehouse 1968), but we know from history that these regions were subsequently colonized by the Greeks (Peloponnesians). To test the relative contribution of Greek colonists versus putative earlier Neolithic settlers, an admixture analysis (Bertorelle and Excoffier 1998) was performed, using E-M78 and J-M172(xM12) as signatures of Greek and Anatolian lineages, respectively. The Anatolian source population was based on 523 Turks, of whom 118 were J- M172(xM12) and 25 were E-M78 (Cinniog˘ lu et al. 2004). The Greek population comprised 36 Peloponnesian samples, 5 of which were J-M172(xM12) and 17 of which were E-M78 (R.K., unpublished data). In spite of the small Peloponnesian sample size, the high E-M78 frequency (47%) observed here is consistent with that (44%) independently found in the same region (Di Gia- como et al. 2003) for the YAP chromosomes harboring microsatellite haplotypes (A. Novelletto, personal communication) typical of Hg E-M78 (Cruciani et al. 2004 [in this issue]; present study). The admixture analysis yielded an admixture proportion from Greece of 0.07 0.15 for the Calabrian samples and of 0.22 0.15 for the Apulian samples. SD was determined by boot- strapping 1,000 replicates.
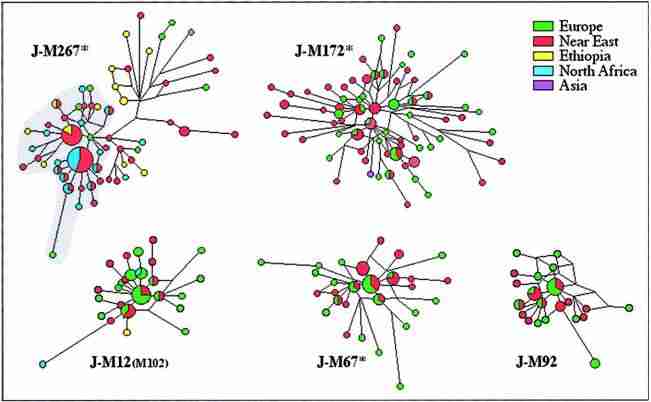
Figure 4 Network of the STR haplotypes of the main subhaplogroups of Hg J. These networks were obtained by the analysis of a subset of the samples for the following microsatellites: YCAIIa, YCAIIb (Mathias et al. 1994), DYS388 (Thomas et al. 1999), DYS19, DYS389, DYS390, DYS391, and DYS392 (Roewer et al. 1996), by the same procedures used for Hg E (fig. 3). Apart from the YCAII system in Hg J- M267, which was considered as a stable marker in this haplogroup (see text), the STR loci were weighted according to their relative variabilityin Hg J. The most complex networks, J-M267* and J-M172*, were calculated by the median-joining method (p 0 ) on the preprocessed data with the reduced-median method; the other networks were calculated by using only the reduced-median algorithm. The shaded area in J-M267* indicates the branch characterized by the YCAIIa-22/YCAIIb-22 motif. For the areas of the circles and the sectors, see figure 3. The expansion time of this branch was calculated using TD (Zhivotovsky 2001), which gives 8.7 and 4.3 ky, respectively, for the earliest and the latest bounds of the expansion time. The former estimate was calculated by using the variance in the number of repeats of the remaining six loci, assuming a variance at the beginning of population separation (V0) equal to zero, and thus gives an upper bound for the TD (Zhivotovsky 2001). The latter assumes a linear approximation of the within-population variance in repeat scores as a function of time and takes a predicted value of V0 prior to population split; because the linearity can be achieved in a case of infinite population size only and because each survived haplogroup started from one individual and could maintain small size for a long time, the linear approximation overestimates V0 and thus might be considered as a lower bound for divergence times (L.A.Z., unpublished method).
The TD of the two sister clades J-M267 and J-M172 was estimated, with V0 p 0, and turned out to be 31.7 ky (see phylogeny in fig. 2). This estimate, however, is not easily interpretable, because such old haplogroups are differently represented in different regions where they probably underwent multiple bottlenecks. The lower internal variance of J-M267 in the Middle East and North Africa, relative to Europe and Ethiopia, is suggestive of two different migrations. In the absence of additional binary polymorphisms allowing further informative subdivision of J-M267, the YCAII microsatellite system provides important insights. The majority of J-M267 Y chromosomes harbor the single-banded motif YCAIIa22-YCAIIb22 in the Middle East (170%) and in North Africa (190%), whereas this association is much less frequent in Ethiopia and only sporadically found in southern Europe. Considering the distribution of this YCAII single-banded pattern-which, besides the usual stepwise mutational mechanism, could be due to a stable mutational event (one locus deletion or a single-nucleotide mutation in the primer sequence)-we suggest that the motif YCAIIa22-YCAIIb22 potentially characterizes a monophyletic clade of J-M267. A comparable situation is observed within Hg I-M170, in which the single-banded and a more-recent diffusion (marked by the YCAIIa-22/YCAIIb-22 motif) of Arab people from the southern part of the Middle East toward North Africa.
Acknowledgments
We are grateful to all the donors for providing blood samples and to the people who contributed to their collection. In particular, we thank Ahmet Arslan, Agnese Brega, and B. Kindar (for samples from Turks); Jaume Bertranpetit and Anne Cam- bon-Thomsen (for samples from Catalans, Basques, and Bearnais); Aiping Liu (for samples from Chinese); J. Garcia-Puche (for samples from Andalusians); and Adriana Grasso and F. Pignatelli (for samples from Apulians). We warmly acknowl- edge two anonymous reviewers for their helpful and construc- tive criticism. This research was supported by Progetto Fin- alizzato CNR “Beni Culturali” (A.S.S.-B.), National Institutes of Health grants GM28428 and GM55273 (L.L.C.-S.), Progetto MIUR-CNR Genomica Funzionale-Legge 449/97 (A.T. and L.L.C.-S), Fondo d’ Ateneo per la Ricerca dell’ Universita` di Pavia (A.S.S.-B and A.T.), the Italian Ministry of the University’ s Progetti Ricerca Interesse Nazionale 2002 and 2003 (A.T.), and Fondo Investimenti Ricerca di Base 2001 (A.T.).
Electronic-Database Information
The URLs for data presented herein are as follows:
Fluxus Engineering, http://www.fluxus-engineering.com (for NETWORK 2.0b)
Y-Chromosome STR Database, http://www.cstl.nist.gov/biotech/strbase/y_strs.htm
References
Al-Zahery N, Semino O, Benuzzi G, Magri C, Passarino G, Torroni A, Santachiara-Benerecetti AS (2003) Y-chromosome and mtDNA polymorphisms in Iraq, a crossroad of the early human dispersal and of post-Neolithic migrations. Mol Phy- logenet Evol 28:458-472
Ammerman AJ, Cavalli-Sforza LL (1984) Neolithic transition and the genetics of populations in Europe. Princeton Uni- versity Press, Princeton, NJ
Bandelt HJ, Forster P, Sykes BC, Richards MB (1995) Mito- chondrial portraits of human populations using median net- works. Genetics 141:743-753
Bertorelle G, Excoffier L (1998) Inferring admixture propor- tions from molecular data. Mol Biol Evol 15:1298-1311
Bosch E, Calafell F, Comas D, Oefner PJ, Underhill PA, Ber- tranpetit J (2001) High-resolution analysis of human Y-chro- mosome variation shows a sharp discontinuity and limited gene flow between northwestern Africa and the Iberian Pen- insula. Am J Hum Genet 68:1019-1029
Brinkmann B, Klintschar M, Neuhuber F, Hu¨ hne J, Rolf B (1998) Mutation rate in human microsatellites: influence of the structure and length of the tandem repeat. Am J Hum Genet 62:1408-1415
Carvalho-Silva DR, Santos FR, Hutz MH, Salzano FM, Pena SD (1999) Divergent human Y-chromosome microsatellite evolution rates. J Mol Evol 49:204-214
Cavalli-Sforza LL (2002) Demic diffusion as the basic process of human expansions. In: Bellwood P, Renfrew C (eds) Ex- amining the farming/language dispersal hypothesis. Mc- Donald Institute for Archaeological Research, Cambridge, United Kingdom, pp 79-88
Cinniog˘ lu C, King R, Kivisild T, Kalfog˘ lu E, Atasoy S, Cavalleri GL, Lillie AS, Roseman CC, Lin AA, Prince K, Oefner PJ, Shen P, Semino O, Cavalli-Sforza LL, Underhill PA (2004) Excavating Y-chromosome haplotype strata in Anatolia. Hum Genet 114:127-148
Cruciani F, La Fratta R, Santolamazza P, Sellitto D, Pascone R, Moral P, Watson E, Guida V, Colomb EB, Zaharova B, Lavinha J, Vona G, Aman R, Calı` F, Akar N, Richards M, Torroni A, Novelletto A, Scozzari R (2004) Phylogeographic analysis of haplogroup E3b (E-M215) Y chromosomes re- veal multiple migratory events within and out of Africa. Am J Hum Genet 74:1014-1022 (in this issue)
Cruciani F, Santolamazza P, Shen P, Macaulay V, Moral P, Olckers A, Modiano D, Holmes S, Destro-Bisol G, Coia V, Wallace DC, Oefner PJ, Torroni A, Cavalli-Sforza LL, Scoz- zari R, Underhill PA (2002) A back migration from Asia to sub-Saharan Africa is supported by high-resolution analysis of human Y-chromosome haplotypes. Am J Hum Genet 70:1197-1214
Delfiner P (1976) Linear estimation of non-stationary spatial phenomena. Guarasio M, David M, Haijbegts C (eds) Ad- vanced geostatistics in the mining industry. Dordrecht, Rei- del, pp 49-68
Di Giacomo F, Luca F, Anagnou N, Ciavarella G, Corbo RM, Cresta M, Cucci F, Di Stasi L, Agostiano V, Giparaki M, Loutradis A, Mammi C, Michalodimitrakis EN, Papola F, Pedicini G, Plata E, Terrenato L, Tofanelli S, Malaspina P, Novelletto A (2003) Clinal patterns of human Y chromosomal diversity in continental Italy and Greece are dominated by drift and founder effects. Mol Phylogenet Evol 28:387-395
Hammer MF, Horai S (1995) Y chromosomal DNA variation and the peopling of Japan. Am J Hum Genet 56:951-962 (erratum 56:1512)
Hammer MF, Karafet T, Rasanayagam A, Wood ET, Altheide TK, Jenkins T, Griffiths RC, Templeton AR, Zegura SL (1998) Out of Africa and back again: nested cladistic analysis of human Y chromosome variation. Mol Biol Evol 15:427-441
Jobling MA, Tyler-Smith C (2003) The human Y chromosome: an evolutionary marker comes of age. Nat Rev Genet 4:598-612
King R, Underhill PA (2002) Congruent distribution of Neo- lithic painted pottery and ceramic figurines with Y-chromo- some lineages. Antiquity 76:707-714
Kivisild T, Rootsi S, Metspalu M, Mastana S, Kaldma K, Parik J, Metspalu E, Adojaan M, Tolk H-V, Stepanov V, Go¨ lge M, Usanga E, Papiha SS, Cinniog˘ lu C, King R, Cavalli-Sforza LL, Underhill PA, Villems R (2003) The genetic heritage of ear- liest settlers persists in both the Indian tribal and caste populations. Am J Hum Genet 72:313-332
Mathias N, Bayes M, Tyler-Smith C (1994) Highly informative compound haplotypes for the human Y chromosome. Hum Mol Genet 3:115-123
Nebel A, Filon D, Hohoff C, Faerman M, Brinkmann B, Oppenheim A (2001) Haplogroup-specific deviation from the stepwise mutation model at the microsatellite loci DYS388 and DYS392. Eur J Hum Genet 9:22-26
Nebel A, Filon D, Weiss DA, Weale M, Faerman M, Oppen- heim A, Thomas MG (2000) High-resolution Y chromo- some haplotypes of Israeli and Palestinian Arabs reveal geo- graphic substructure and substantial overlap with haplotypes of Jews. Hum Genet 107:630-641
Nebel A, Landau-Tasseron E, Filon D, Oppenheim A, Faerman M (2002) Genetic evidence for the expansion of Arabian tribes into the southern Levant and North Africa. Am J Hum Genet 70:1594-1596
Passarino G, Semino O, Quintana-Murci L, Excoffier L, Ham- mer M, Santachiara-Benerecetti AS (1998) Different genetic components in the Ethiopian population, identified by mtDNA and Y-chromosome polymorphisms. Am J Hum Ge- net 62:420-434
Quintana-Murci L, Krausz C, Zerjal T, Sayar SH, Hammer MF, Mehdi SQ, Ayub Q, Qamar R, Mohyuddin A, Radha- krishna U, Jobling MA, Tyler-Smith C, McElreavey K (2001) Y-chromosome lineages trace diffusion of people and lan- guages in southwestern Asia. Am J Hum Genet 68:537-542
Roewer L, Kayser M, Dieltjes P, Nagy M, Bakker E, Krawczak M, de Knijff P (1996) Analysis of molecular variance(AMOVA) of Y-chromosome-specific microsatellites in two closely related human populations. Hum Mol Genet 5:1029-1033
Rosser ZH, Zerjal T, Hurles ME, Adojaan M, Alavantic D, Amorim A, Amos W, et al (2000) Y-chromosomal diversity in Europe is clinal and influenced primarily by geography, rather than by language. Am J Hum Genet 67:1526-1543
Santachiara-Benerecetti AS, Semino O, Passarino G, Torroni A, Brdicka R, Fellous M, Modiano G (1993) The common Near- Eastern origin of Ashkenazi and Sephardi Jews supported by Y-chromosome similarity. Ann Hum Genet 57:55-64
Scozzari R, Cruciani F, Pangrazio A, Santolamazza P, Vona G, Moral P, Latini V, Varesi L, Memmi MM, Romano V, De Leo G, Gennarelli M, Jaruzelska J, Villems R, Parik J, Ma- caulay V, Torroni A (2001) Human Y-chromosome variation in the western Mediterranean area: implications for the peo- pling of the region. Hum Immunol 62:871-884
Scozzari R, Cruciani F, Santolamazza P, Malaspina P, Torroni A, Sellitto D, Arredi B, Destro-Bisol G, De Stefano G, Rick- ards O, Martinez-Labarga C, Modiano D, Biondi G, Moral P, Olckers A, Wallace DC, Novelletto A (1999) Combined use of biallelic and microsatellite Y-chromosome polymor- phisms to infer affinities among African populations. Am J Hum Genet 65:829-846
Semino O, Passarino G, Brega A, Fellous M, Santachiara-Be- nerecetti AS (1996) A view of the Neolithic demic diffusion in Europe through two Y chromosome-specific markers. Am J Hum Genet 59:964-968
Semino O, Passarino G, Oefner PJ, Lin AA, Arbuzova S, Beck- man LE, De Benedictis G, Francalacci P, Kouvatsi A, Lim- borska S, Marcikiae M, Mika A, Mika B, Primorac D, Santa- chiara-Benerecetti AS, Cavalli-Sforza LL, Underhill PA (2000) The genetic legacy of Paleolithic Homo sapiens sapiens in extant Europeans: a Y chromosome perspective. Science 290:1155-1159
Semino O, Santachiara-Benerecetti AS, Falaschi F, Cavalli-Sforza LL, Underhill PA (2002) Ethiopians and Khoisan share the deepest clades of the human Y-chromosome phylogeny. Am J Hum Genet 70:265-268
Thomas MG, Bradman N, Flin HM (1999) High throughput analysis of 10 microsatellite and 11 diallelic polymorphisms on the human Y-chromosome. Hum Genet 105:577-581
Thomas MG, Skorecki K, Ben-Ami H, Parfitt T, Bradman N, Goldstein DB (1998) Origins of Old Testament priests. Na- ture 394:138-140
Torroni A, Semino O, Rose G, De Benedictis G, Brancati C, Santachiara Benerecetti AS (1990) Mitochondrial DNA poly- morphisms in the Albanian population of Calabria (southern Italy). Int J Anthropol 5:97-104
Underhill PA, Passarino G, Lin AA, Shen P, Mirazon Lahr M, Foley RA, Oefner PJ, Cavalli-Sforza LL (2001) The phylo- geography of Y chromosome binary haplotypes and the ori- gins of modern human populations. Ann Hum Genet 65:43-62
Underhill PA, Shen P, Lin AA, Jin L, Passarino G, Yang WH, Kauffman E, Bonne-Tamir B, Bertranpetit J, Francalacci P, Ibrahim M, Jenkins T, Kidd JR, Mehdi SQ, Seielstad MT, Wells RS, Piazza A, Davis RW, Feldman MW, Cavalli-Sforza LL, Oefner PJ (2000) Y chromosome sequence variation and the history of human populations. Nat Genet 26:358-361
Weale ME, Shah T, Jones AL, Greenhalgh J, Wilson JF, Nyma- dawa P, Zeitlin D, Connell BA, Bradman N, Thomas M (2003) Rare deep-rooting Y chromosome lineages in humans: lessons for phylogeography. Genetics 165:229-234
Whitehouse R (1968) The early Neolithic of southern Italy. Antiquity 42:188-193
Y Chromosome Consortium (YCC) (2002) A nomenclature sys- tem for the tree of human Y-chromosomal binary haplo- groups. Genome Res 12:339-348
Zhivotovsky LA (2001) Estimating divergence time with use of microsatellite genetic distances: impacts of population growth and gene flow. Mol Biol Evol 18:700-709
Zhivotovsky LA, Underhill PA, Cinniog˘ lu C, Kayser M, Morar B, Kivisild T, Scozzari R, Cruciani F, Destro-Bisol G, Spedini G, Chambers GK, Herrera RJ, Yong KK, Gresham D, Tour- nev I, Feldman MW, Kalaydjieva L (2004) The effective mu- tation rate at Y chromosome short tandem repeats, with ap- plication to human population-divergence time. Am J Hum Genet 74: 50-61 Am. J. Hum. Genet. 74:1023-1034, 2004
ΠΡΟΣΟΧΗ: Στο τέλος κάθε σελίδας του Ανώνυμου Απολογητή θα παρουσιάζονται νεοπαγανιστικές και αθεϊστών (δήθεν ελληνιστών) απάτες που έχουν σχέση με το θέμα της σελίδας. Αυτές οι απάτες δεν έχουν σκοπό να βάλουν τα περιοδικά στα οποία εμφανίζονται τα νεοπαγανιστικά ψεύδη, εφόσον ούτως ή άλλως παγανιστές συγγράφουν σε διάφορα ανυποψίαστα εξ αυτών και αυτά δεν εκφράζονται από τις απόψεις των αρθρογράφων, αλλά σκοπό έχουν:
1. να καταδείξουν τον κρυφοπαγανιστή αρθρογράφο ώστε να γίνει γνωστός και
2. είτε ο κάθε ενδιαφερόμενος που αναγιγνώσκει εκ νέου άρθρα του να θέτει τον εαυτό του εν εγρήγορση και να ελέγχει θαρρετά τα ψεύδη του κρυφοπαγανιστή (δήθεν ελληνιστή), αν είναι μελετημένος και έχει πρόσβαση σε πρωτογενή βιβλιογραφία
3. είτε εάν δεν έχει πρόσβαση σε βιβλιογραφία, να μην δείχνει πλέον εμπιστοσύνη στον αρθογράφο εφόσον γνωρίζει πως εκφράζει ψεύδη για να σπιλώσει τον Χριστιανισμό υποστηρίζοντας θέσεις παγανισμού, που όμως δεν είναι σχεδόν ποτέ ξεκάθαρες, αλλά που παρουσιάζονται ως «ελληνικές» μιας και η πλειοψηφία των νεοπαγανιστών ντρέπεται να ομολογήσει δημοσίως την θρησκεία που ακολουθεί και προτιμά να καμουφλάρεται με κάτι οικοιότερο, τον πατριωτισμό, που όμως αρρωστημένα έχει μετατραπεί σε ένα παγανιστικό εθνικισμό.
ΕΞΑΙΡΕΣΗ: εξαιρούνται τα προσωπικά βιβλία του κρυφοπαγανιστή αθρογράφου ή τα έντυπα με καθαρά νεοπαγανιστικό προσανατολισμό, ανάμεσα στα τόσα που κυκλοφορούν στην Ελλάδα.


Τον έκαναν «Άγιο» από το παράθυρο. Δημήτριος Ιατρόπουλος. Ποιητής. (Πηγή: Σταθμός Alter, απογευματινό δελτίο ειδήσεων, Σάββατο 11 Ιουνίου 2004)
ΕΡΜΗΝΕΥΤΙΚΟ ΔΙΑΤΥΠΩΜΑ: ... Εκ των υστέρων αναλύοντας λοιπόν βλέπω ότι αυτό που τότε έγραψα σχεδόν με αυτόματη γραφή περιείχε το σπέρμα της αυτογνωσίας και της ανάγκης του προς τα μέσα ταξιδιού, μία καθαρά αρχαιοελληνική -και γιατί όχι «γονιδιακά κατοχυρωμένη», θα το πω εδώ κι ας πουν ό,τι θέλουν κάποιοι...- πρόταση ζωής. (Πηγή: Δημήτριος Ιατρόπουλος, Περιοδικό Ιχώρ, τεύχος 55, λόγου χάριν, σελ. 41)
Οι αποκαλύψεις έρευνας για το DNA.
Μια σειρά ερευνών που σαν σκοπό είχαν αφ’ ενός να προσδιορίσουν την γενετική καθαρότητα των φυλών της Μεσογειακής Ευρώπης συμπεριλαμβανομένης της Μικράς Ασίας και αφ’ ετέρου να χαρτογραφήσουν τυχόν γενετικές ομοιότητες ανάμεσα σε πληθυσμούς διαφορετικών χωρών πραγματοποιήθηκε από σειρά ευρωπαίων και Αμερικανών ερευνητών υπό την εποπτεία του Πανεπιστημίου του Στάνφορντ των ΗΠΑ, την ερευνητική ομάδα του καθηγητή του ΑΠΘ κυρίου Κωνστανίνου Τριανταφυλλίδη και το πανεπιστήμιο της Παβίας στην Ιταλία. Τα αποτελέσματα δείχνουν ότι το DNA των Ελλήνων, το οποίο ανήκει στην λευκή φυλή (καυκάσια όπως αναφέρεται στην διεθνής ορολογία), είναι σε ποσοστό 99,5% καθαρό και ανεπηρέαστο από επιμιξίες, πράγμα ιδιαιτέρως εντυπωσιακό αν αναλογισθεί κανείς ότι τα 400 χρόνια της Τουρκοκρατίας και το γεγονός ότι η Ελλάδα αποτελεί σταυροδρόμι που ενώνει τρεις Ηπείρους και ως εκ τούτου λαμβάνουν χώρα σε έντονες διαδικασίες γενετικών ζυμώσεων. Αν μάλιστα σε αυτά προστεθούν και τα αποτελέσματα παλαιότερων μελετών που υποστηρίζουν την γενετική και φυλετική συνέχεια των Ελλήνων από την αρχαιότητα έως σήμερα, τότε μιλάμε για ένα πολύ ανθεκτικό και ισχυρό ελληνικό γονιδίωμα. Το δεύτερο σκέλος της έρευνας επιφύλασσε εξίσου συναρπαστικά αποτελέσματα. Η μελέτη του γενετικού υλικού των πληθυσμών διαφόρων χωρών έδειξε αυτό που στα αποτελέσματα της έρευνας αναφέρεται σαν μετάδοση του ελληνικού γεννητικού κώδικα από τα νεολιθικά κιόλας χρόνια στην Ευρώπη και στην Μικρά Ασία, με μεγαλύτερα ποσοστά στην Ιταλία, Γαλλία, Ισπανία και την Τουρκία! Ειδικά δε για τη Νότια Ιταλία, την λεγόμενη Μεγάλη Ελλάδα, το 20% των κατοίκων της έχουν ακόμη και σήμερα, 2500 χρόνια από την εποχή που αυτές οι περιοχές ήταν ελληνικές αποικίες, το ίδιο γεννητικό υλικό με τους Έλληνες και ειδικά εκείνου της Πελοποννήσου. Εκτός όμως από την Πελοπόννησο τόσο η περιοχή της Θεσσαλίας όσο και αυτή της Κεντρικής Μακεδονίας υπήρξε εστία αποικισμού πολλών περιοχών προς βορρά (κοιλάδα Αξιού, Δούναβης και βόρειες περιοχές) στις οποίες μετοίκησαν ελληνικά φύλλα. Από τα ανωτέρω στοιχεία γίνεται κατανοητό το πόσο βαθιές χρονικά είναι οι ρίζες των Ελλήνων, πόσο καταλυτικά επηρέασαν οι ελληνικοί αποικισμοί την ευρωπαϊκή ήπειρο αλλά και πόσο ξεχωριστό και ισχυρό είναι το DNA του ελληνικού έθνους, το οποίο κουβαλάει μέσα του την πολιτισμική μνήμη του έθνους, ενώ εξασφαλίζει παράλληλα την άρρηκτη συνέχεια των Ελλήνων στο χρόνο. (Πηγή: Περιοδικό Ιχώρ, τεύχος 63-64, Δια-δικτυακά, σσ. 6 -7)
Μυθοπλάστης: Περιοδικό Ιχώρ & Δημήτριος Ιατρόπουλος
Απάντηση: Βάση της ανάλυσης των όσων λέγονται εις το άνωθι κείμενο του Ιχώρ, προκύπτουν δύο τινά:
α. είτε οι νεοπαγανιστές δεν αντιλαμβάνονται τι αναγράφουν οι επιστημονικές μελέτες
β. είτε τις διαστρεβλώνουν εκ προθέσεως.
Πού βρίσκεται όμως η «μεταφυσική» αλλοίωση αυτής της μελέτης; Δεν είναι δύσκολο να εντοπισθεί και κρύβεται εις την απλή αντιστροφή της σειράς των λέξεων. Ενώ λοιπόν η αρχική ορθή δήλωση «...το DNA των Ελλήνων» αναφέρεται εις τον γεννητικό κώδικα που κουβαλούν οι σημερινοί Έλληνες και «το οποίο ανήκει στην λευκή φυλή (καυκάσια όπως αναφέρεται στην διεθνής ορολογία)», καθοδόν αυτό το γονιδίωμα μετατρέπεται σε «ελληνικό γονιδίωμα» που είναι «ανθεκτικό και ισχυρό» που μετώκησε «από τα νεολιθικά κιόλας χρόνια στην Ευρώπη και στην Μικρά Ασία». Με λίγα λόγια ο γεννητικός κώδικας αποκτά ελληνική συνείδηση και ο Έλληνας δεν μένει παρά να διαχωρίζεται βάση του DNA, για το οποίο όμως λέχθει πως «ανήκει στην λευκή φυλή (καυκάσια όπως αναφέρεται στην διεθνής ορολογία)» και εις την οποία ανήκουν και άλλα έθνη της σημερινής Ευρώπης. Δηλαδή με άλλα λόγια για τον κάθε εθνικιστή της Ευρώπης το «ελληνικό γονιδίωμα» με την ίδια «παγανιστική λογική» μπορεί κάλλιστα να μετατραπεί σε γονιδίωμα οποιασδήποτε άλλης λευκής εθνότητας, εφόσον την νεολιθική εποχή που το γεννητικό γονιδίωμα μετώκησε στην Γηραιά Ήπειρο κανείς εκ των λαών που αναφέρονται στην μελέτη δεν είχε εθνική συνείδηση με την έννοια που της αποδίδεται σήμερα. Η εθνικότητα ακολούθησε μετά το γονιδίωμα και όχι το αντίστροφο.
Αν δεχτεί κανείς πως το γονιδίωμα κατασκευάζει και προσδιορίζει την εθνικότητα και τις ιδιότητές της («ελληνικού γεννητικού κώδικα») τότε:
1. Η ίδια η ελληνική παιδεία, την οποία έμμεσα υποστηρίζουν οι νεοπαγανιστές πολέμιοι της λογικής όταν ζητούν να κατηγορήσουν το Βυζάντιο λέγοντας «πως την κατάργησε», αποκτά μηδενική αξία, εφόσον όλα ανάγονται σε γονίδια και τίποτε δεν μένει να προσδιοριστεί από τα συγγράμματα και δηλαδή από την κοινωνική επιρροή εις τον άνθρωπο εφόσον το «ελληνικό γονιδίωμα», «κουβαλάει μέσα του την πολιτισμική μνήμη του έθνους».
2. Κανείς δεν γνωρίζει γιατί η (ελληνική) εθνικότητα δεν εμφανίστηκε από την πρώτη στιγμή που «εμφανίστηκε» και το λεγόμενο «ελληνικό γονιδίωμα» αλλά πολύ αργότερα.
3. Κανείς δεν γνωρίζει γιατί «χρειάστηκε» μια κοινωνική συνθήκη, ο λεγόμενος «διαφωτισμός», για να αφυπνιστούν οι Έλληνες από τον «Χριστιανικό σκοταδισμό» του Βυζαντίου και να «αποτινάξουν την Ρωμιοσύνη», σύμφωνα με τις κοινές αποδοχές των νεοπαγανιστών και δεν χρειάστηκε η διέλευση μετεωριτών και άλλων ιπταμένων αντικειμένων ώστε να δημιουργηθεί αφύπνιση «των γενετικών κωδικών των Ελλήνων», αλλά και «Η επίδραση, του Σείριου» που «αφυπνίζει την Ιερά Ελληνική Φυλή, καθώς ο Ιχώρ κοχλάζει και ο Δρόμος του Ελληνικού θριάμβου ήδη καθαρίζει από τα αγκάθια!» (βλέπε δηλώσεις Ιωάννη Φουράκη και Ανέστη Κεραμυδά κάτωθι)
4. Κανείς δεν γνωρίζει με ποιο γονιδιακό τρόπο οι Ιάπωνες τουρίστες που κλαίνε στην Ακρόπολη των Αθηνών μετατρέπονται σε «Έλληνες» από τους νεοπαγανιστές. (1)
5. Τέλος κανείς δεν γνωρίζει γιατί οι Έλληνες με την «γονιδιακή» «πολιτισμική μνήμη» της ειδωλολατρίας ασπάζονται εδώ και 2000 χρόνια τον Ιησού Χριστό. Φαίνεται πως το «ελληνικό γονιδίωμα» δεν είναι διόλου «ανθεκτικό και ισχυρό» μπρος στην Αποστολική Διακονία.
Η διαστρέβλωση της επιστημονικής αυτής μελέτης κατά τον δηλωμένο τρόπο οδηγεί κατόπιν τους νεοπαγανιστές σε πιο εθνικιστικά συμπεράσματα, εφόσον θεωρούν πως υπάρχει «ανθεκτικό και ισχυρό ελληνικό γονιδίωμα». Ουσιαστικά δεν υπάρχει «ανθεκτικό» γονιδίωμα, εφόσον το γονιδίωμα των Ελλήνων για το οποίο γίνεται λόγος είναι ουσιαστικά η απλοομάδα, γνωστή ως JM (2) που περνά αναλλοίωτη από πατέρα σε υιό, δηλαδή δεν επηρεάζεται από την μητέρα. Με άλλα λόγια το λεγόμενο «ανθεκτικό και ισχυρό ελληνικό γονιδίωμα» δεν συμμετέχει σε κάποια είδους «γενετική μίξη» ώστε να λέγεται πως μπορεί να «αντέχει εφόσον ισχυρό», αλλά απλώς δείχνει αν σε ένα γεωγραφικό χώρο έχουν μετοικίσει πληθυσμοί με διαφορετικές απλοομάδες και όχι αν έχουν διασταυρωθεί με πληθυσμούς άλλων απλοομάδων. Επίσης οι διαφορετικές απλοομάδες, που φέρουν άλλες εθνότητες, θα μπορούσαν το ίδιο να χαρακτηριστούν «ανθεκτικές και ισχυρές» σύμφωνα με την παγανιστική «λογική» και κανείς δεν θα έπρεπε να ξέρει να πει γιατί εκείνο το «ελληνικό» να είναι το μόνο «ανθεκτικό και ισχυρό» που κουβαλά την «πολιτισμική μνήμη» και όχι λ.χ. και το γερμανικό, ιταλικό, ελβετικό κ.ο.κ.
Τέλος οι νεοπαγανιστές θαυμάζουν «πόσο καταλυτικά επηρέασαν οι ελληνικοί αποικισμοί την ευρωπαϊκή ήπειρο αλλά και πόσο ξεχωριστό και ισχυρό είναι το DNA του ελληνικού έθνους». Ξεχνούν όμως κατά περίεργο τρόπο να δηλώσουν πως άλλο τόσο η Ελλάδα και η Ευρώπη έχει «επηρεαστεί» από αποικισμούς Ανατολικών Γεωργών και Αφρικανών νωρίτερα (3). Ίσως ξεχνούν να το δηλώσουν, διότι αν και οι νεοπαγανιστές άπειρες φορές κάνουν λόγο για αντιγραφές και κλεψιές του «πρωτο-πολιτισμού» και των «πρωτο-ιδεών» των Ελλήνων από τρίτους, εντούτοις όταν έχουν να κάνουν με «πολιτισμική μνήμη» που είναι «γονιδιακά κατοχυρωμένη», όπως στην προκειμένη περίπτωση που κάποιο «DNA ..., το οποίο κουβαλάει μέσα του την πολιτισμική μνήμη του έθνους» και το οποίο ανήκει δικαιωματικά νωρίτερα στην Καυκάσια «λευκή φυλή», δεν επιθυμούν να αποδώσουν σε άλλους «τρίτους» τα δέοντα ευχαριστήρια. Με αντιφατικό θράσος κατόπιν βγαίνουν παγανιά οι αθρογράφοι τους στα νεοπαγανιστικά περιοδικά για να κυνηγήσουν την «ανύπαρκτη Μαύρη Αθηνά» και όλα όσα αυτοί ουσιαστικά με τις ρατσιστικές θεωρίες τους σπέρνουν στα χωράφια των αναγνωστών τους.
Τα δείγματα που πιστοποίησαν «την γενετική και φυλετική συνέχεια των Ελλήνων από την αρχαιότητα έως σήμερα» αναφέρονται σε 12.400 άτομα από 29 πληθυσμούς κυρίως της Ευρώπης και της Μεσογείου αλλά επίσης και της Αφρικής και της Ασίας (4). Ουσιαστικά η δειγματοληψία αυτή είναι επαρκής για την εξαγωγή στατιστικών ανθρωπολογικών μελετών αλλά είναι εντελώς άχρηστη για την «πιστοποίηση της εθνικής συνείδησης όλων των πολιτών» των εν λόγων γεωγραφικών περιοχών. Μόνο η γεωγραφική Ελλάς απαρτίζεται σήμερα (2006) από περισσότερους από 10.000.000 πολίτες. Ποιος είναι εκείνος που θα τολμήσει να διεξάγει γενετική έρευνα για τις απλοομάδες JM στην Ελλάδα βάση των οποίων θα προσδιορίσει την εθνικότητα και τι θα έχει να «απολογηθεί» ένας νεοπαγανιστής που δεν βρεθεί να έχει μέσα του το λεγόμενο «ανθεκτικό και ισχυρό», «ελληνικό γονιδίωμα» αλλά κάποιο διαφορετικό;
Η τελευταία ασυδοσία της νεοπαγανιστικής αλογίας, είναι το παράδειγμα της απάτης του «Ηρακλή και των Κελτών», στον οποίο φαίνεται πως αν και η επιστήμη δέχεται πλέον βάση ανάλογων αναλύσεων του DNA ότι οι Κέλτες της Βρετανίας ήταν απόγονοι των αυτόχθονων λαών της Ιβηρικής, εντούτοις οι νεοπαγανιστές ορίζουν τους πρώτους αλλά και τους λοιπούς λαούς των Βρετανικών νησιών ως «απόγονους» του Ηρακλή και άλλων Ελλήνων...
Η νεοπαγανιστική θεωρία πως «μιλάμε για ένα πολύ ανθεκτικό και ισχυρό ελληνικό γονιδίωμα» ανεξήγητα, και με ένα είδους «νεοπαγανιστικού θαύματος» προκύπτει να κινδυνεύει «από τις επιμειξίες που επιτρέπουν οι Χριστιανοί», σύμφωνα με τον ιερέα του Δία, Παναγιώτη Μαρίνη. Για ακόμη μια φορά Μέγας και ’γιος Βασίλειος για τους ειδωλολάτρες «...εμείς δεν έχουμε ανάγκη να ξετινάξουμε τις θεωρίες τους. Αρκούν οι ίδιοι να ανατρέπουν ο ένας τον άλλο. »
Τα κάτωθι είναι αποσπάσματα των άρθρων του περιοδικού Άρδην:
α. Ιωάννης Φουράκης

Ιωάννης Φουράκης, Συγγραφέας. (Πηγή: Ραδιοτηλεοπτικός σταθμός «Alter», Εκπομπή «Οι Πύλες του Ανεξήγητου», 18 Δεκεμβρίου 2004)
Στη συνέχεια μαθαίνουμε για έναν παράξενο κομήτη, το ΗΒ, που πέρασε εκείνο τον καιρό δίπλα από τον πλανήτη μας. Οι σκοποί του δεν διέφυγαν καθόλου από τον κ. Φουράκη: Η αφύπνιση των γενετικών κωδικών των Ελλήνων ήταν το βασικό «έργο» του μυστηριώδους κομήτη, που η ΝΑSΑ θέλησε να αποκρύψει, ακόμα και τις φωτογραφίες του. Εδώ όμως πρέπει να τονίσω ότι δεν είναι όλοι οι πολίτες του κράτους Ελλάδα. Έλληνες, αλλά αυτοί που τους χαρακτηρίζει μια γενετική ιδιαιτερότητα. Αυτή την ιδιαιτερότητα την είχαν ανακαλύψει οι Δυτικοί και δημιούργησαν το κρατίδιο Ελλάδα. Αυτό ήταν ένα από τα μεγαλύτερα εγκλήματα εις βάρος του Ελληνισμού. Ο Ελληνισμός και ο Έλληνας δεν έχουν ανάγκη κράτους. Το κράτος είναι παγίδευση. Πήγανε να φτιάξουν το κρατίδιο της Πελοποννήσου με την επανάσταση του ‘21 και είχανε σκοπό να «μαντρώσουν» εκεί πέρα τους Έλληνες και να τους βάλουν να σκοτωθούν μεταξύ τους, όπως και έγινε με τις συνεχείς επαναστάσεις των καπεταναίων.[]
....
Α. Η συνεχώς διευρυνόμενη και αναπτυσσόμενη αυτοαπονάρκωσι και αυτενεργοποίησι των φυλετικών, εθνικών και προπατορικών μνημικών και μιμητικών κυττάρων (DΝΑ) (των Ελλήνων).
Επεκταθήκαμε για να δώσουμε, με όσο το δυνατόν μεγαλύτερη σαφήνεια, τη σκέψη του κυρίου Φουράκη. Ας δούμε τώρα την άποψη του για την καταγωγή των Ελλήνων: Ο Έλλην είναι θεός, διότι έχει ποιηθεί εκ του Θεού των Θεών και εστάλη επί του πλανήτου μας δια να είναι (και είναι) φορεύς και δότης του Θείου πνεύματος και ΛΟΓΟΥ.
β. Ανέστης Κεραμυδάς

Αριστερά: Ανέστης Κεραμυδάς, Συγγραφέας. (Πηγή: Τηλεοπτικός Σταθμός Alter, εκπομπή Αθέατος Κόσμος - Τρίτη 19 Οκτωβρίου 2004)
Δεξιά: Ομάδα Έψιλον, Η τελική Αναμέτρηση Δελφών & Σιών, Ανέστης Κεραμυδάς, Συγγραφέας (Πηγή: http://www.greekbooks.gr/books/showbook.asp?bookID=169320)
Ο συγγραφέας ολοκληρώνει κι αυτό το πόνημα με το συνήθη του τρόπο. Από το τελευταίο κεφάλαιο, με τίτλο «Η εκδίκησης των Ελλήνων», παραθέτουμε την τελευταία φράση: Η επίδραση, του Σείριου αφυπνίζει την Ιερά Ελληνική Φυλή, καθώς ο Ιχώρ κοχλάζει και ο Δρόμος του Ελληνικού θριάμβου ήδη καθαρίζει από τα αγκάθια! Έσσεται ήμαρ!!!
Πηγή: Άρδην, τ. 52, Ιανουάριος - Μάρτιος 2005, σ. 27-33
«Ως Έλλην, από την Ομηρική ήδη εποχή έως και σήμερα δύναται να θεωρηθεί μόνον εκείνος ο οποίος μετέχει του Όμαιμου στοιχείου, δηλαδή, ανήκει από φυλετικής απόψεως στο Ελληνικό Έθνος. (...) Όσοι επιχειρούν να βεβηλώσουν την έννοια της Ελληνικότητας παραβλέποντας το κριτήριο της καταγωγής (...) υπονομεύουν τα θεμέλια του Ελληνισμού. Ας μην λησμονούμε λοιπόν την πατρογονική επιταγή «ΠΑΣ ΜΗ ΕΛΛΗΝ ΒΑΡΒΑΡΟΣ»....
....Κάποιος Κ. Ιωάννου γράφει άρθρο με τίτλο «Ο Σατανισμός, ιδεολογικό προϊόν του Εβραϊσμού». Ο εκδότης, σε άρθρο του με τίτλο «Ελληνικότης και Ελληνισμός», παραθέτει εντός πλαισίου τα εξής από τον Κ. Πλεύρη: Από τα πανάρχαια χρόνια οι Έλληνες εκαυχώντο δια την υπεροχήν της φυλής των (όμαιμον). Το «πας μη ‘Ελλην βάρβαρος» είναι μια αλήθεια που επιβεβαίωσε ιστορία χιλιετιών. Κάθε φυλή έχει την αξίαν του πολιτισμού της. Επομένως, η Ελληνική Φυλή ως δημιουργήσασα άφθαστον πολιτισμόν προέχει όλων των άλλων. Όποιος αμφισβητεί την Ανωτερότητα της Ελληνικής Φυλής είναι Προδότης.
Όσον αφορά την «ελληνικότητα», ο εκδότης λέει μεταξύ άλλων:
(...) Πώς όμως ορίζεται η Ελληνικότητα και με γνώμονα ποια κριτήρια διαπιστώνεται; Ως Ελληνική ορίζεται η Κοινότητα εκείνη του Αίματος και του Πολιτισμού, η οποία συντίθεται από γηγενείς κατοίκους που συγκροτούν μια ενιαία Εθνική Οντότητα. Απορρίπτει αγανακτισμένος την Ισοκράτεια αντίληψη, κατά την οποία: η Ελληνικότητα καθορίζεται με βάση όχι τα φυλετικά και ψυχικά χαρακτηριστικά αλλά την απόκτηση της Ελληνικής Παιδείας, οπότε κι οι θιασώτες αυτής της θεωρήσεως ομιλούν περί «πνευματικώς Ελλήνων». Κι ακόμα, ο κ. Χαραλαμπόπουλος απαγορεύει στους μη Αρίους να μετέχουν της ελληνικής παιδείας!
Ένας Σκανδιναυός ή ένας Κέλτης που έχει συνειδητοποιήσει την αφετηρία της καταγωγής και του πολιτισμού του δύναται να μετέχει στην «ημετέρα παιδεία», ανήκοντας στη φυλετική ομοεθνία των Ελλήνων-Αρίων. Δεν μπορεί ωστόσο να συμβεί το ίδιο με έναν Τούρκο ή ένα Μογγόλο ή ένα Νέγρο, θα ήταν Ύβρις προς τη Φύση και τον Πολιτισμό, καθ’ ό,τι η ψυχοσύνθεσή του είναι εντελώς διαφορετική (...). Τ
Στο 41o τεύχος, ο Κ. Θεοδωρίδης, σε άρθρο του για τον αλβανικό UCK και την αλυτρωτική του προπαγάνδα για δήθεν Τσάμηδες στην Ελλάδα, γράφει: Η λύση για εθνική επιβίωση και ανάπτυξη, η εκδίωξη όλων ανεξαιρέτως των ξένων από την Πατρίδα μας. (...)
Στέλιος Φανός
*Απόσπασμα από το βιβλίο του Στέλιου Φανού, Οδηγός των βιβλίων για την Αρχαία Ελλάδα, Β΄ Τόμος, που κυκλοφορεί από τις εκδόσεις «Κίνηση Ιδεών» (σελ. 772-801).
Πηγή: Άρδην, τ. 53, Απρίλιος - Μάιος 2005, σ. 28-33
Γεώργιος Πάλμος

Βίντεο: Μέγεθος 18Kb - Διάρκεια: 16΄΄ Γενικά στους νέους και τις νέες της Ελλάδος, να προσπαθούν να υπερκεράσουν αυτή την αποβλάκωση που επιδιώκουν διάφορα αποικιοκρατικά κέντρα και να ξυπνήσουν μέσα τους αυτό που υπάρχει στα κύτταρά τους, δηλαδή το Ιχώρ, τα γονίδια των Ελλήνων. ( Πηγή: Γεώργιος Πάλμος, Ερευνητής, Εξωγήινες αϋπνίες - Χειμώνας 2003)
ΠΑΡΑΡΤΗΜΑ
01 Ιουνίου 2004 - 11:22
Γνήσιοι ως Έλληνες σε ποσοστό 99,5%
Το εντυπωσιακό συμπέρασμα ότι εδώ και 2.500 χρόνια, κατά προσέγγιση, η γενετική ταυτότητα των Ελλήνων έχει παραμείνει αναλλοίωτη σε ποσοστό 99,5%, χωρίς επιμειξίες από άλλους πληθυσμούς, προκύπτει από μελέτη διεθνούς ερευνητικής ομάδας, που δημοσιεύτηκε στο κορυφαίο επιστημονικό περιοδικό του είδους. Στην ομάδα, στην οποία μετείχαν κορυφαίοι επιστήμονες από ολόκληρο τον κόσμο - ανάμεσά τους και ο καθηγητής Βιολογίας του Αριστοτέλειου Πανεπιστημίου Θεσσαλονίκης κ. Κωνσταντίνος Τριανταφυλλίδης - ερευνητές από οκτώ ομάδες, χρησιμοποιώντας δείγματα 2.400 ανδρών από 29 διαφορετικούς πληθυσμούς - ανάμεσά τους 143 Έλληνες - μπόρεσαν να δουν κυριολεκτικά την ιστορία μέσα από το χρωμόσωμα Υ και τις απλοομάδες του. Η σημασία των πορισμάτων της έρευνας για τη γενετική ταυτότητα των Ελλήνων είναι καθοριστική, όπως σημείωσε στη "Νέα Κρήτη" ο κ. Κωνσταντίνος Τριανταφυλλίδης, αν σκεφτεί κανείς ότι το εν λόγω χρωμόσωμα και κυρίως η απλοομάδα του, γνωστή ως JM, κληρονομείται αναλλοίωτη από τον πατέρα στα αγόρια του, χωρίς να χάνει τα χαρακτηριστικά της στο διάβα των αιώνων. Έτσι, μπόρεσε να αναγνωριστεί από τα δείγματα των 143 Ελλήνων, και να πληροφορήσει τους επιστήμονες όχι μόνο για το γεγονός ότι οι Έλληνες ανήκουν αμιγώς σε συντριπτικό ποσοστό στην Καυκάσια, λευκή φυλή - με τις όποιες προσμίξεις να καταγράφονται μονάχα στο απειροελάχιστο ποσοστό του 0.5% - αλλά και για το ότι οι Έλληνες μετέφεραν το DNA τους και τη λάμψη του ελληνικού πολιτισμού σε ένα μεγάλο τμήμα της δυτικής Ευρώπης, σε κύματα εποικισμού.
Είναι πραγματικά συγκλονιστικό να γυρίζει κανείς στο χρόνο και να βλέπει, με τις σύγχρονες ερευνητικές μεθόδους, ότι εδώ και δυόμισι χιλιετίες, όπως αποκαλύπτει η μελέτη του γενετικού υλικού, το χρωμόσωμα Υ, το οποίο απαντάται στους άντρες, διατηρεί αναλλοίωτο το "γενετικό αποτύπωμά" του! Πρόκειται για γεγονός που επιβεβαιώνει ιστορικές και αρχαιολογικές μαρτυρίες, αποκαλύπτοντας πολλές αλήθειες για τους Έλληνες, και "κλείνει στόματα" που γέννησαν θεωρίες όπως αυτή της λεγόμενης "Μαύρης Αθηνάς".
Δημοσιευμένη σε ένα από τα πιο σημαντικά έγκυρα επιστημονικά περιοδικά του κόσμου, το "American Human Genetics", η μελέτη από οκτώ ερευνητικές ομάδες, με συντονιστή το Πανεπιστήμιο Στάνφορντ των ΗΠΑ, με τη συμμετοχή του φημισμένου ιταλικού Πανεπιστήμιου της Παβίας και πέντε εργαστηρίων - ανάμεσά τους αυτό της Μόσχας και της Βαγδάτης - χαρτογράφησε ουσιαστικά την πορεία των λαών στη Μεσόγειο. Τη σημασία της έρευνας με θέμα "Προέλευση, διασπορά και διαφοροποίηση των απλοομάδων Ε και J του χρωμοσώματος Υ: συμπεράσματα για τη νεολιθική αποίκηση της Ευρώπης και τα μετέπειτα μεταναστευτικά γεγονότα στην περιοχή της Μεσογείου" επιτείνει τόσο ο μεγάλος αριθμός των δειγμάτων, ο οποίος θεωρείται κάτι παραπάνω από αντιπροσωπευτικός, και το γεωγραφικό εύρος της έρευνας - από την Ευρώπη, με έμφαση στη Μεσόγειο, τη Μικρά Ασία και την Αφρική - όσο και η συμμετοχή κορυφαίων ονομάτων στο χώρο της επιστήμης. Ανάμεσά τους είναι και ο πατέρας της σύγχρονης Γενετικής του ανθρώπου ο κ. Λουκά Καβάλι Σφόρτζα, ο οποίος, όπως μας ανέφερε ο κ. Τριανταφυλλίδης, αν και βρίσκεται σε ηλικία 92 ετών, συνεχίζει να παραμένει δραστήριος και παραγωγικός, έχοντας συνδέσει το όνομά του με κορυφαίες ανακαλύψεις.
Πηγή: http://www.cretetv.gr/news/newsf.php?ArtID=8741
Σημειώσεις
1. Τηλεοπτικός Σταθμός Alter, Οι Πύλες του Ανεξήγητου, θέμα «Τα μυστικά των αρχαίων» 18/02/2006, εδώ
2. (4) J-M172(xM12) distribution is consistent with a Levantine/ Anatolian dispersal route to southeastern Europe and may reflect the spread of Anatolian farmers; and (5) E-M78 (for which microsatellite data suggest an eastern African origin) and, to a lesser extent, J-M12(M102) lineages would trace the subsequent diffusion of people from the southern Balkans to the west. A 7%-22% contribution of Y chromosomes from Greece to southern Italy was estimated by admixture analysis. (Πηγή: Περιοδικό Am. J. Hum. Genet. 74:1023-1034, 2004)
3. The phylogeography of Y-chromosome haplogroups E (Hg E) and J (Hg J) was investigated in 12,400 subjects from 29 populations, mainly from Europe and the Mediterranean area but also from Africa and Asia. The observed 501Hg E and 445 Hg J samples were subtyped using 36 binary markers and eight microsatellite loci. Spatial patterns reveal that (1) the two sister clades, J-M267 and J-M172, are distributed differentially within the Near East, North Africa, and Europe; (2) J-M267 was spread by two temporally distinct migratory episodes, the most recent one probably associated with the diffusion of Arab people; (3) E-M81 is typical of Berbers, and its presence in Iberia and Sicily is due to recent gene flow from North Africa; (4) J-M172(xM12) distribution is consistent with a Levantine/ Anatolian dispersal route to southeastern Europe and may reflect the spread of Anatolian farmers; and (5) E-M78 (for which microsatellite data suggest an eastern African origin) and, to a lesser extent, J-M12(M102) lineages would trace the subsequent diffusion of people from the southern Balkans to the west. A 7%-22% contribution of Y chromosomes from Greece to southern Italy was estimated by admixture analysis. (Πηγή: ό.π.)
3. 12,400 subjects from 29 populations, mainly from Europe and the Mediterranean area but also from Africa and Asia (Πηγή: ό.π.)
4. Παν.Μαρίνης, Η ελληνική θρησκεία, εκδ. Ελεύθερη Σκέψις, Αθήνα 1996, σελ.126
Τηλεοπτικοί Σταθμοί
1. Alter, απογευματινό δελτίο ειδήσεων, Σάββατο 11 Ιουνίου 2004, Οι Πύλες του Ανεξήγητου, θέμα «Τα μυστικά των αρχαίων» 18/02/2006
Περιοδικά
1. Am. J. Hum. Genet. 74:1023-1034, 2004
2. Ιχώρ, τεύχος 63-64
3. ’ρδην, τεύχη 52,53
Βιβλία
1. Παν.Μαρίνης, Η ελληνική θρησκεία, εκδ. Ελεύθερη Σκέψις, Αθήνα 1996
Διαδίκτυο
1. http://www.cretetv.gr/news/newsf.php?ArtID=8741